Usage
Summarization
Making a Summarization Request
The following GIF shows how to enter text, select summarizers, set the summary length, and execute the summarization request.
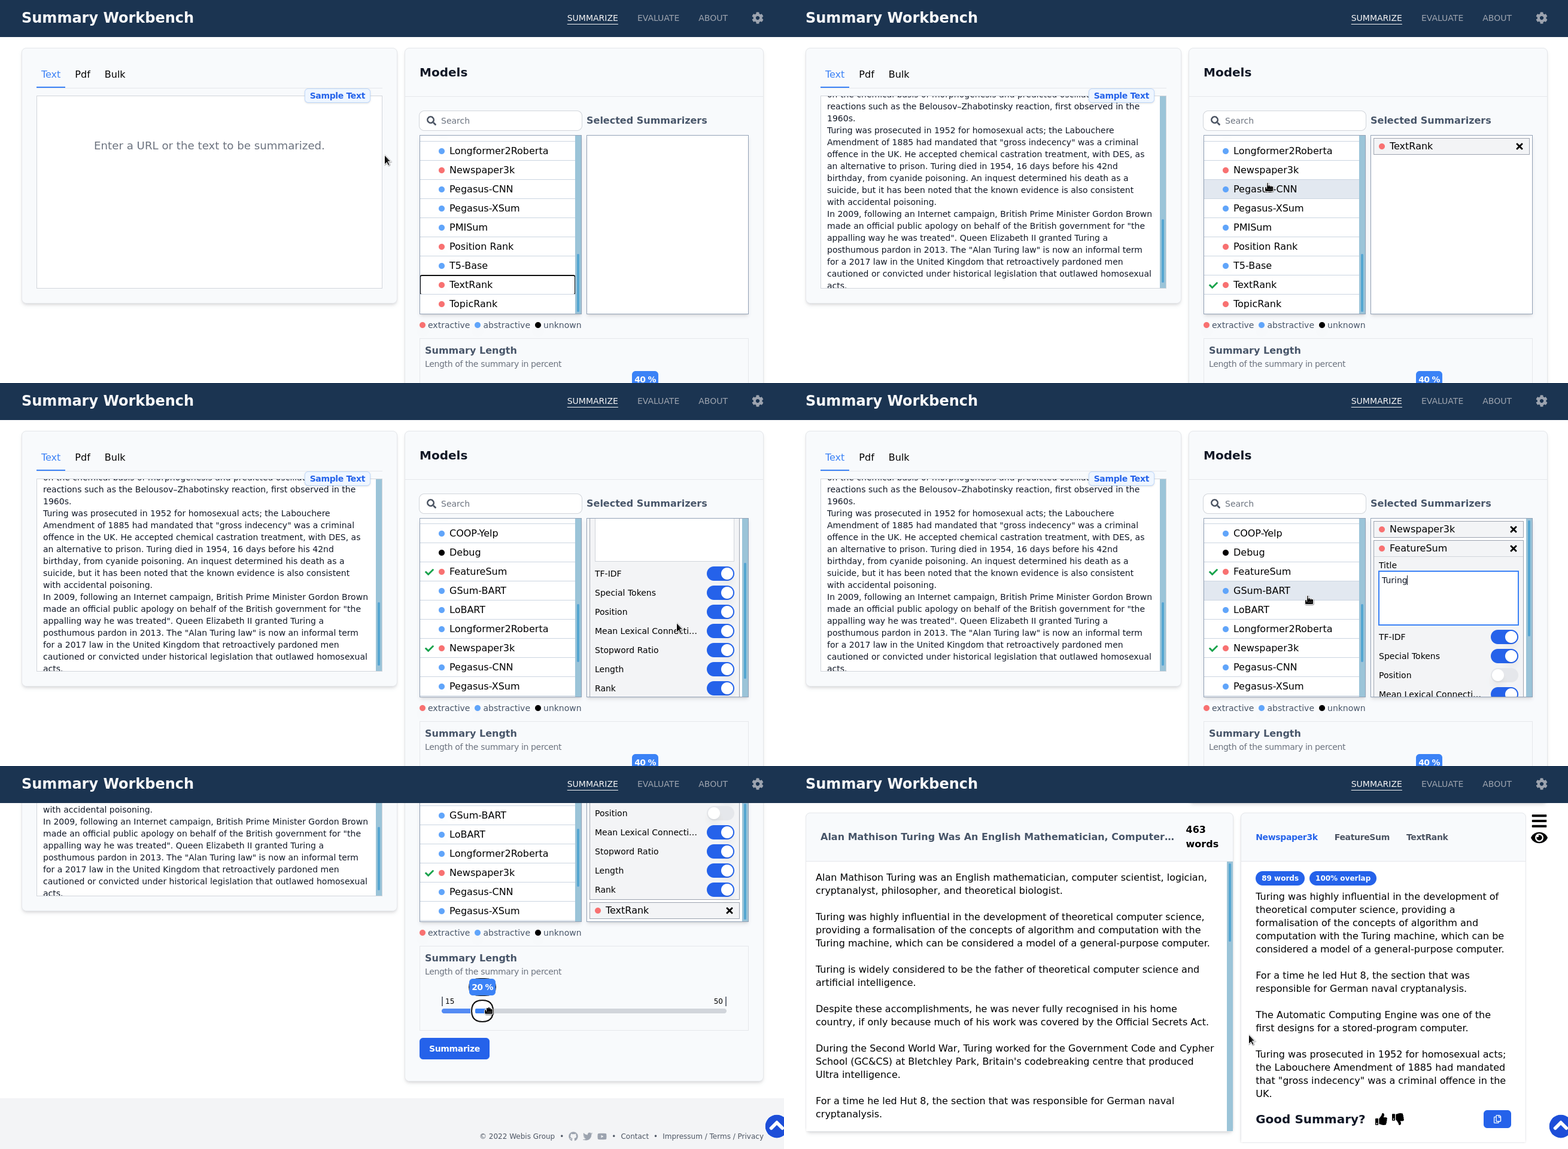
In the demo there is also a Debug plugin, which is meant for us to to test the deployment for bugs.
This Summarizer will never produce meaningful results.
Inspect the Summaries
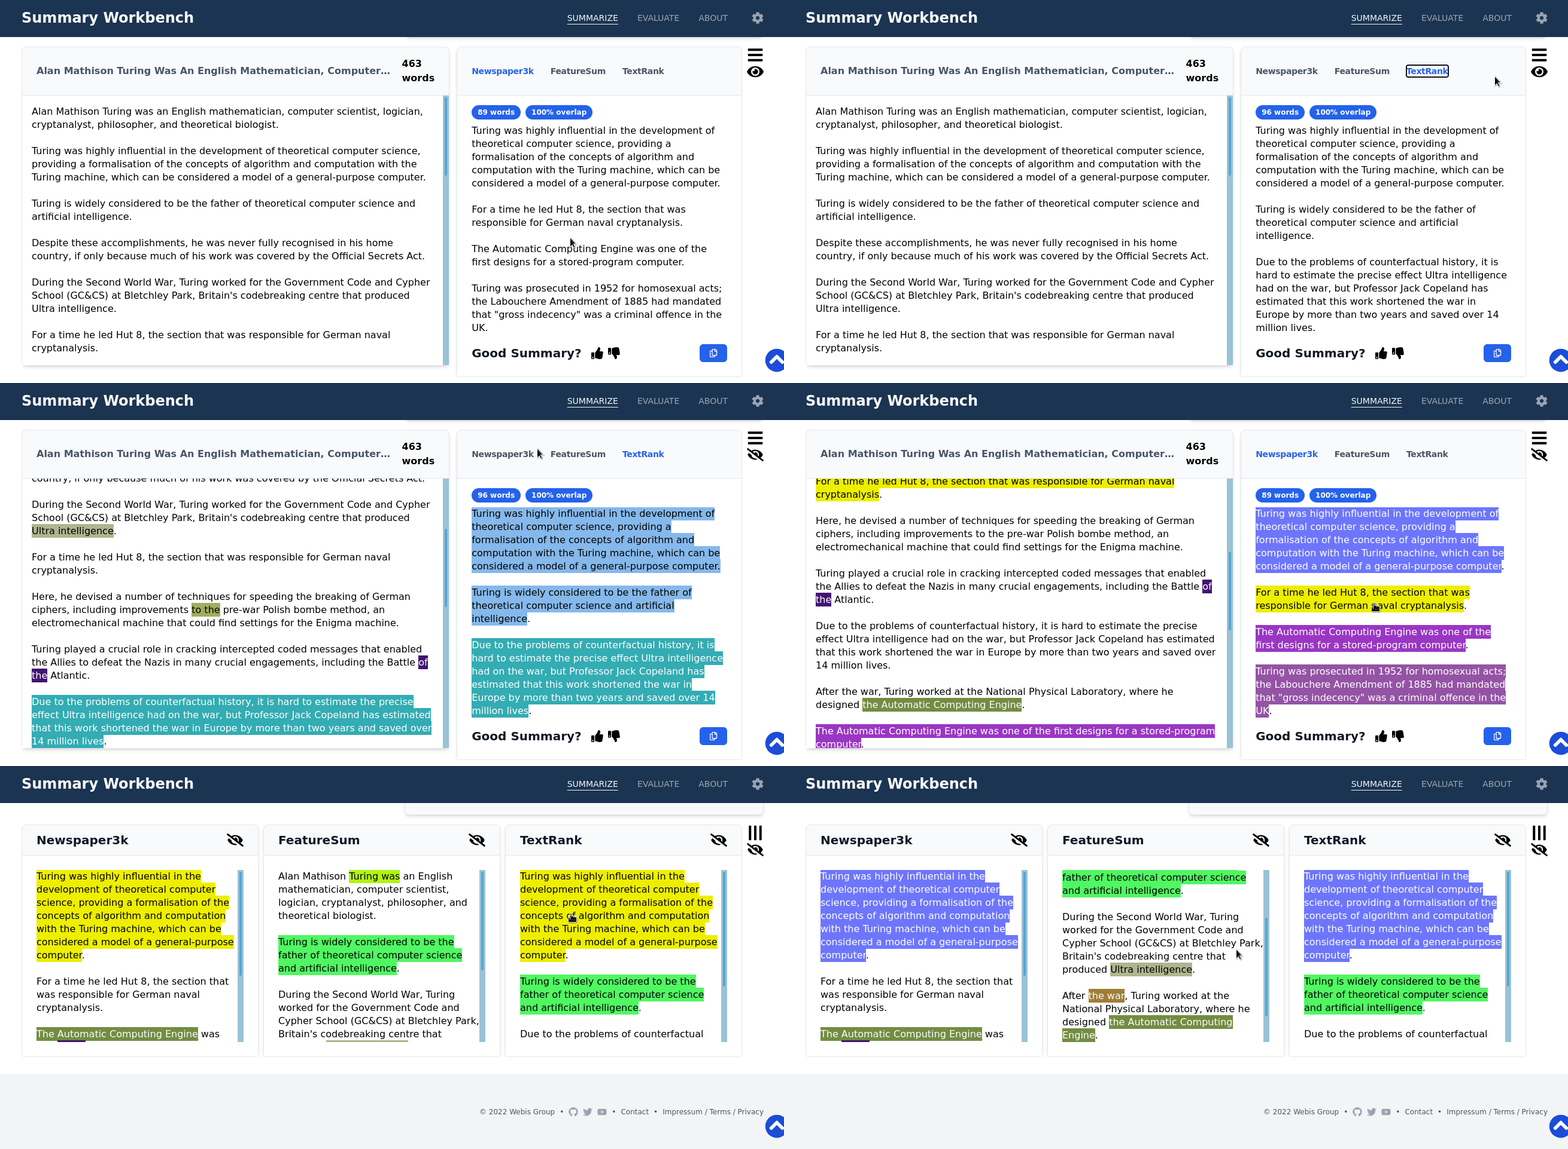
After executing the request the document with its summaries is shown. By clicking the eye-icon, the lexical overlap is shown to see what part of the document got reused in the summary. By clicking the bar-icon, the lexical overlap of the summaries with each other is shown. By hovering an overlap section, all corresponding sections are highlighted in yellow and by clicking the section, the corresponding sections are scrolled into view.
Using a PDF Document as Input for the Summarization
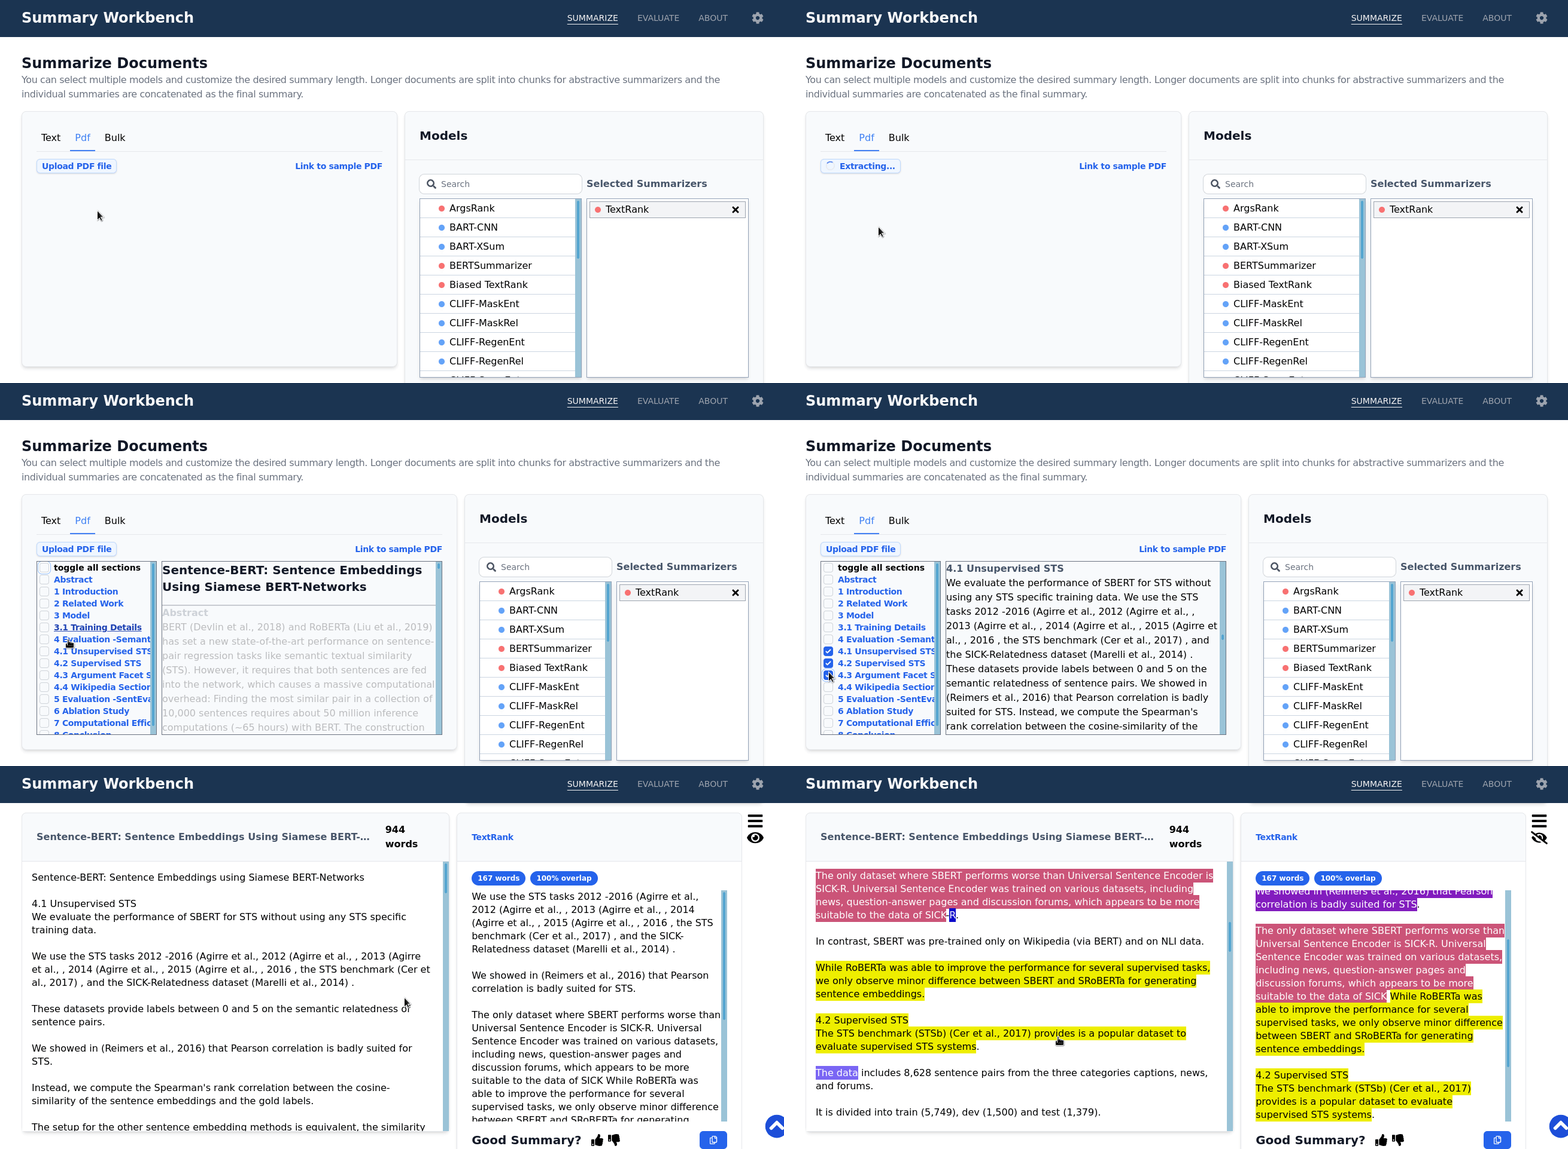
Alternatively, a PDF-document can be used as an input. The text is extracted with Grobid and extracted sections are shown on the left. By clicking the entry, a section can be selected. The selected sections are concatenated when submitted for summarization.
Evaluation
Making an Evaluation Request
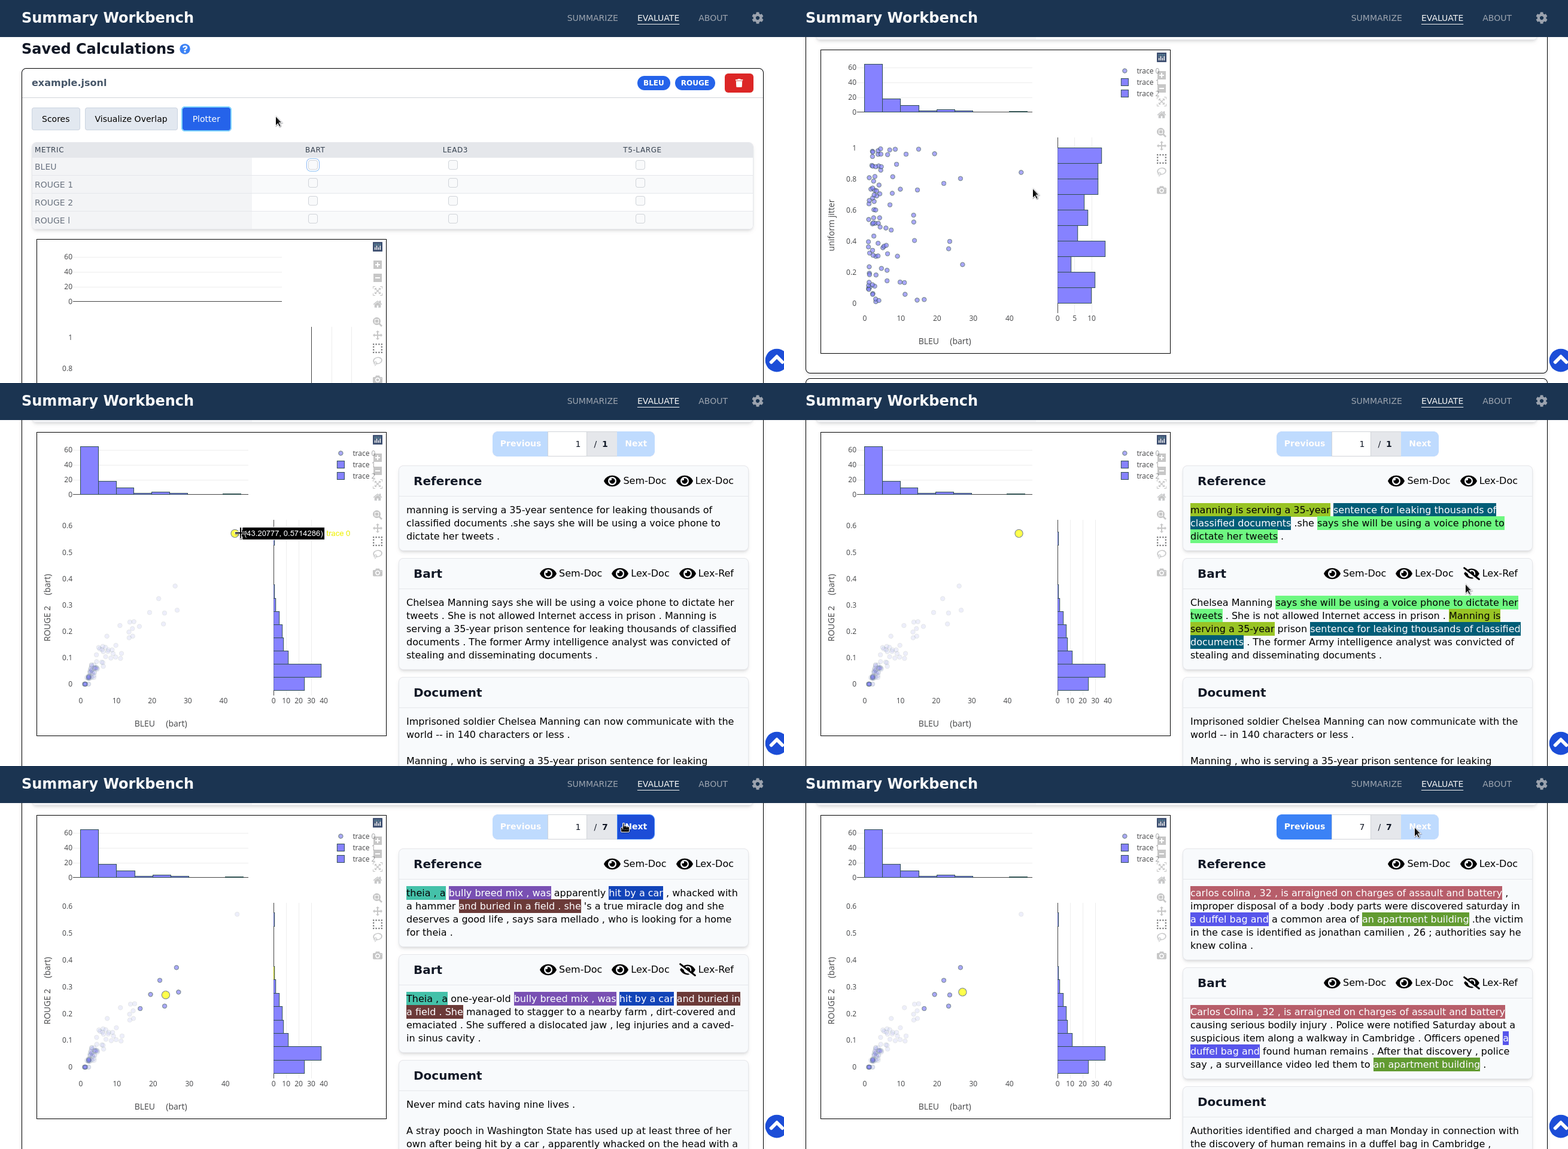
The following GIF shows how to input a file for evaluation, select metrics, execute the evaluation request, and save the result.
By hovering the question mark, a hint will appear that explains the required file format.
An example file can be downloaded by clicking the Download Sample File button.
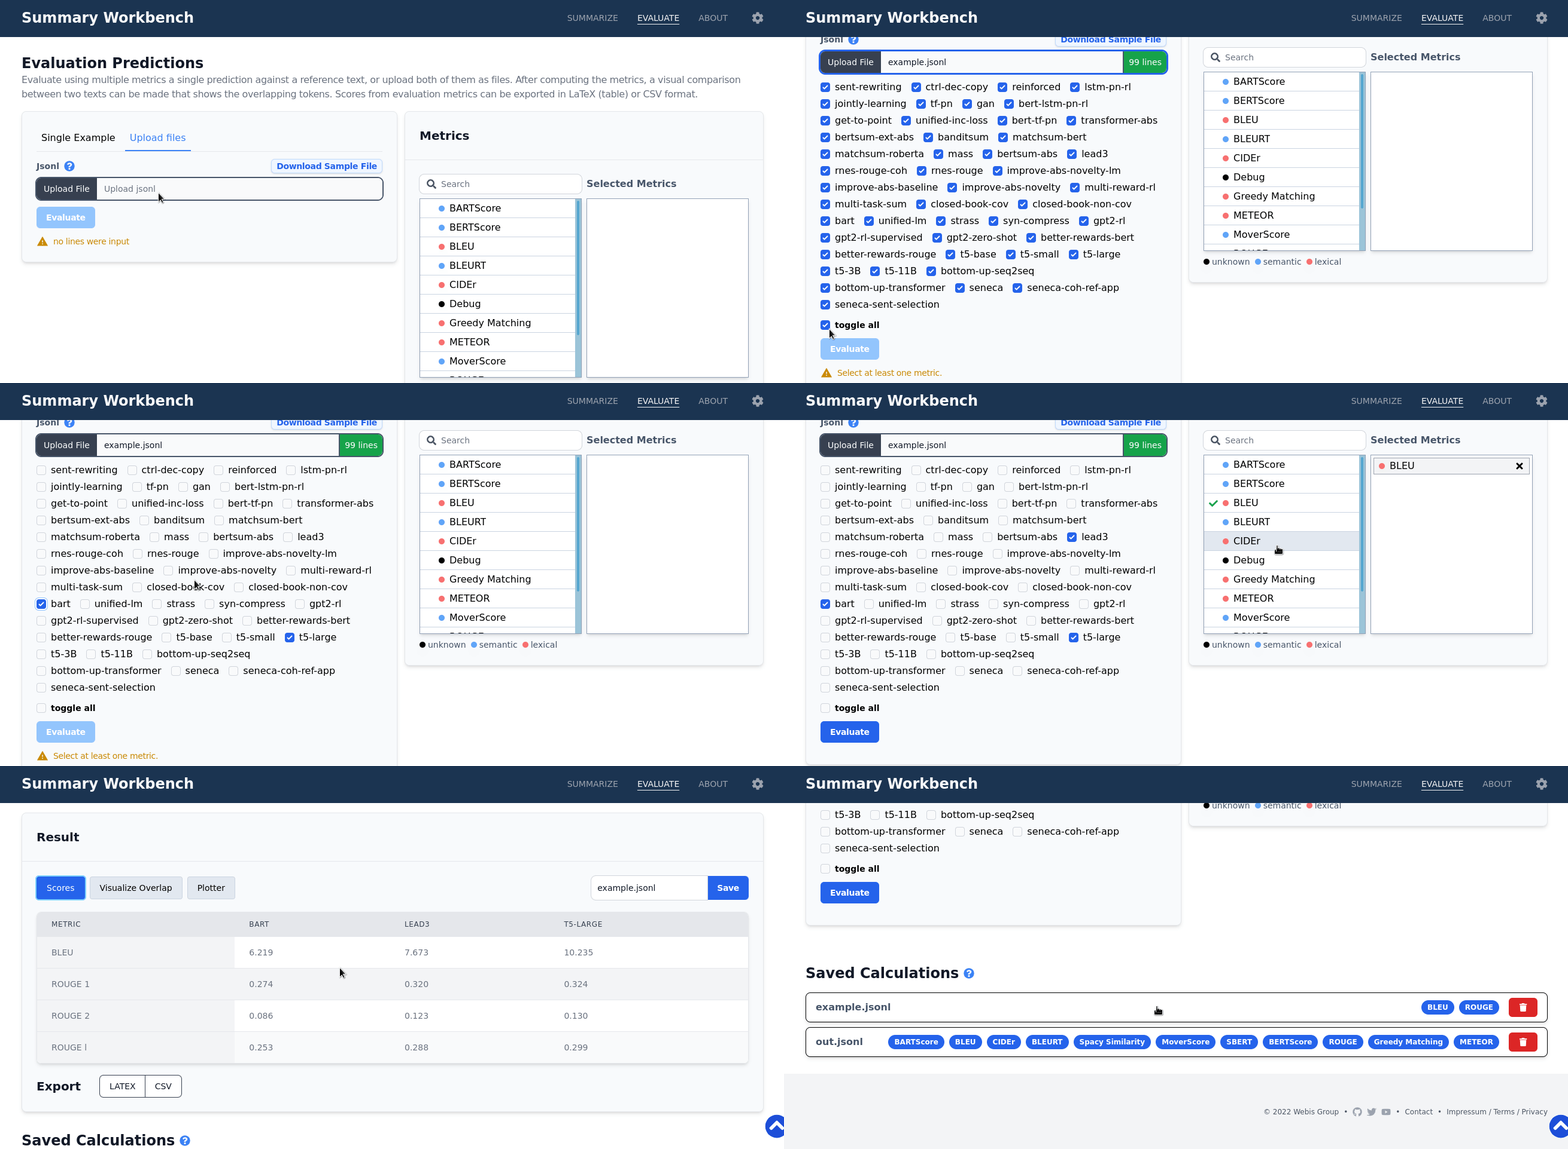
In the demo there is also a Debug plugin, which is meant for us to to test the deployment for bugs.
This Metric will never produce meaningful results.
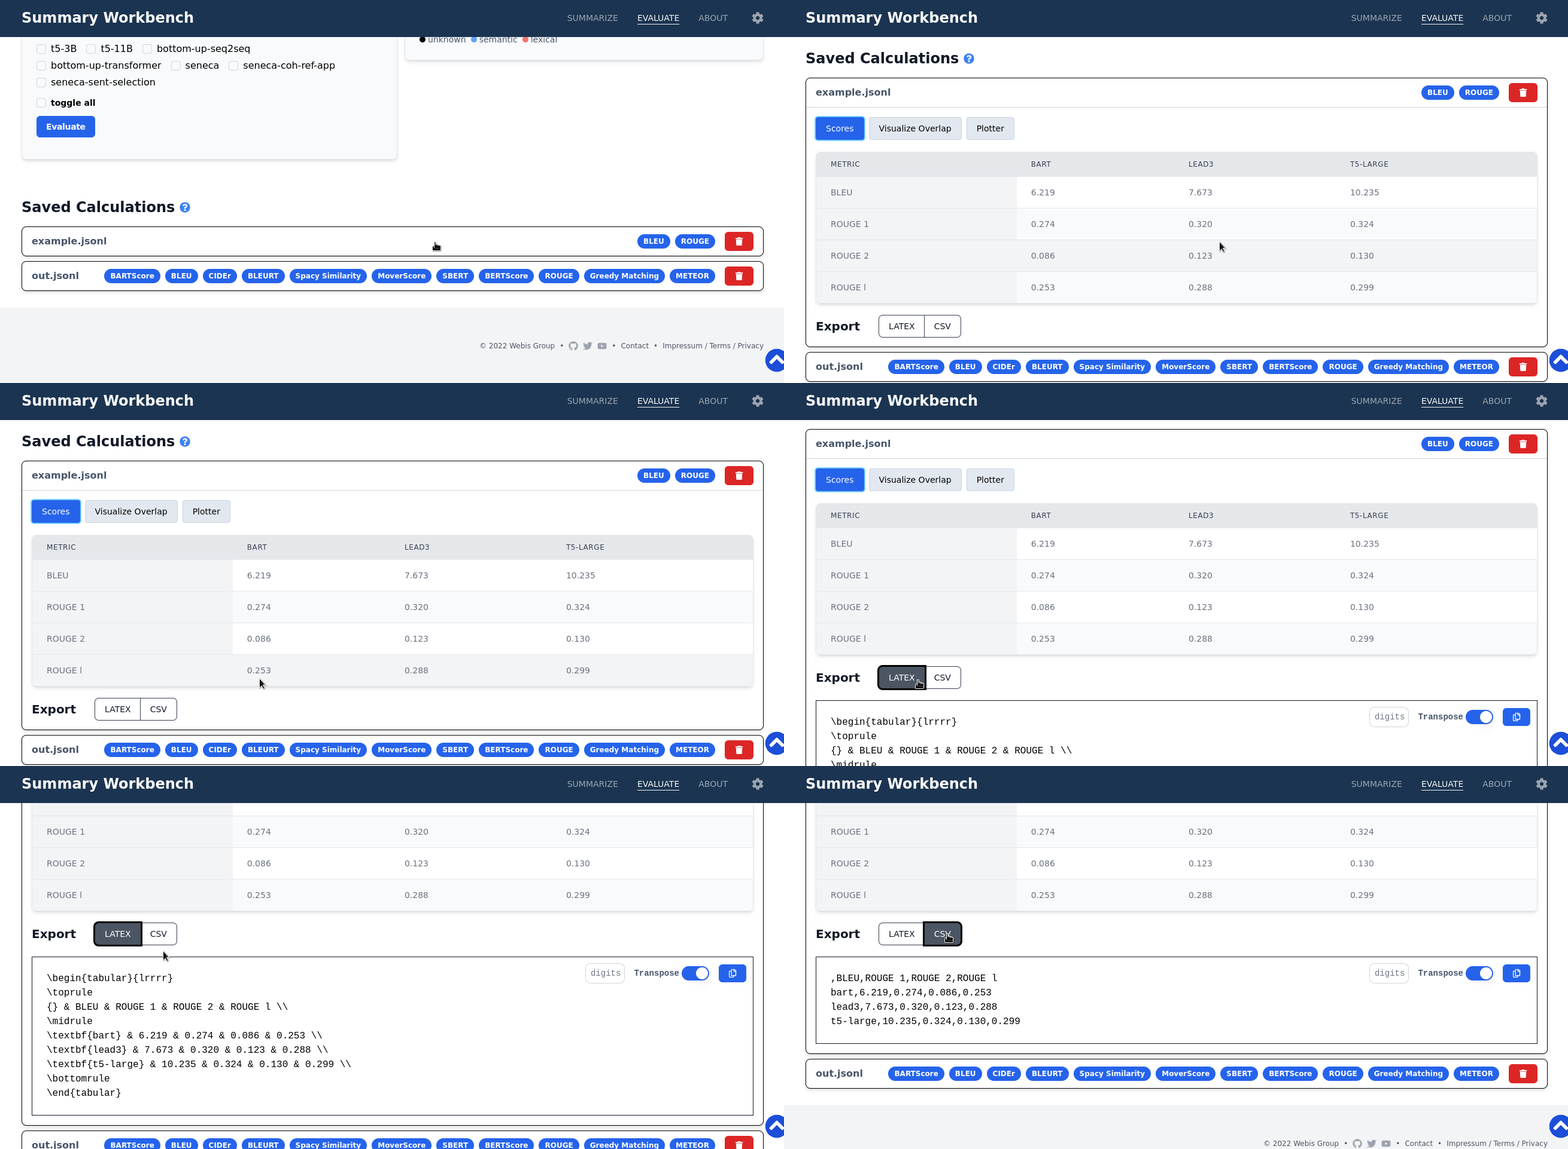
Show Average Scores after Evaluating
The first tab shows the average score for the corresponding metric-model pair in a table. Scores can be exported as latex table or CSV.
Visualize the Overlap for the Examples
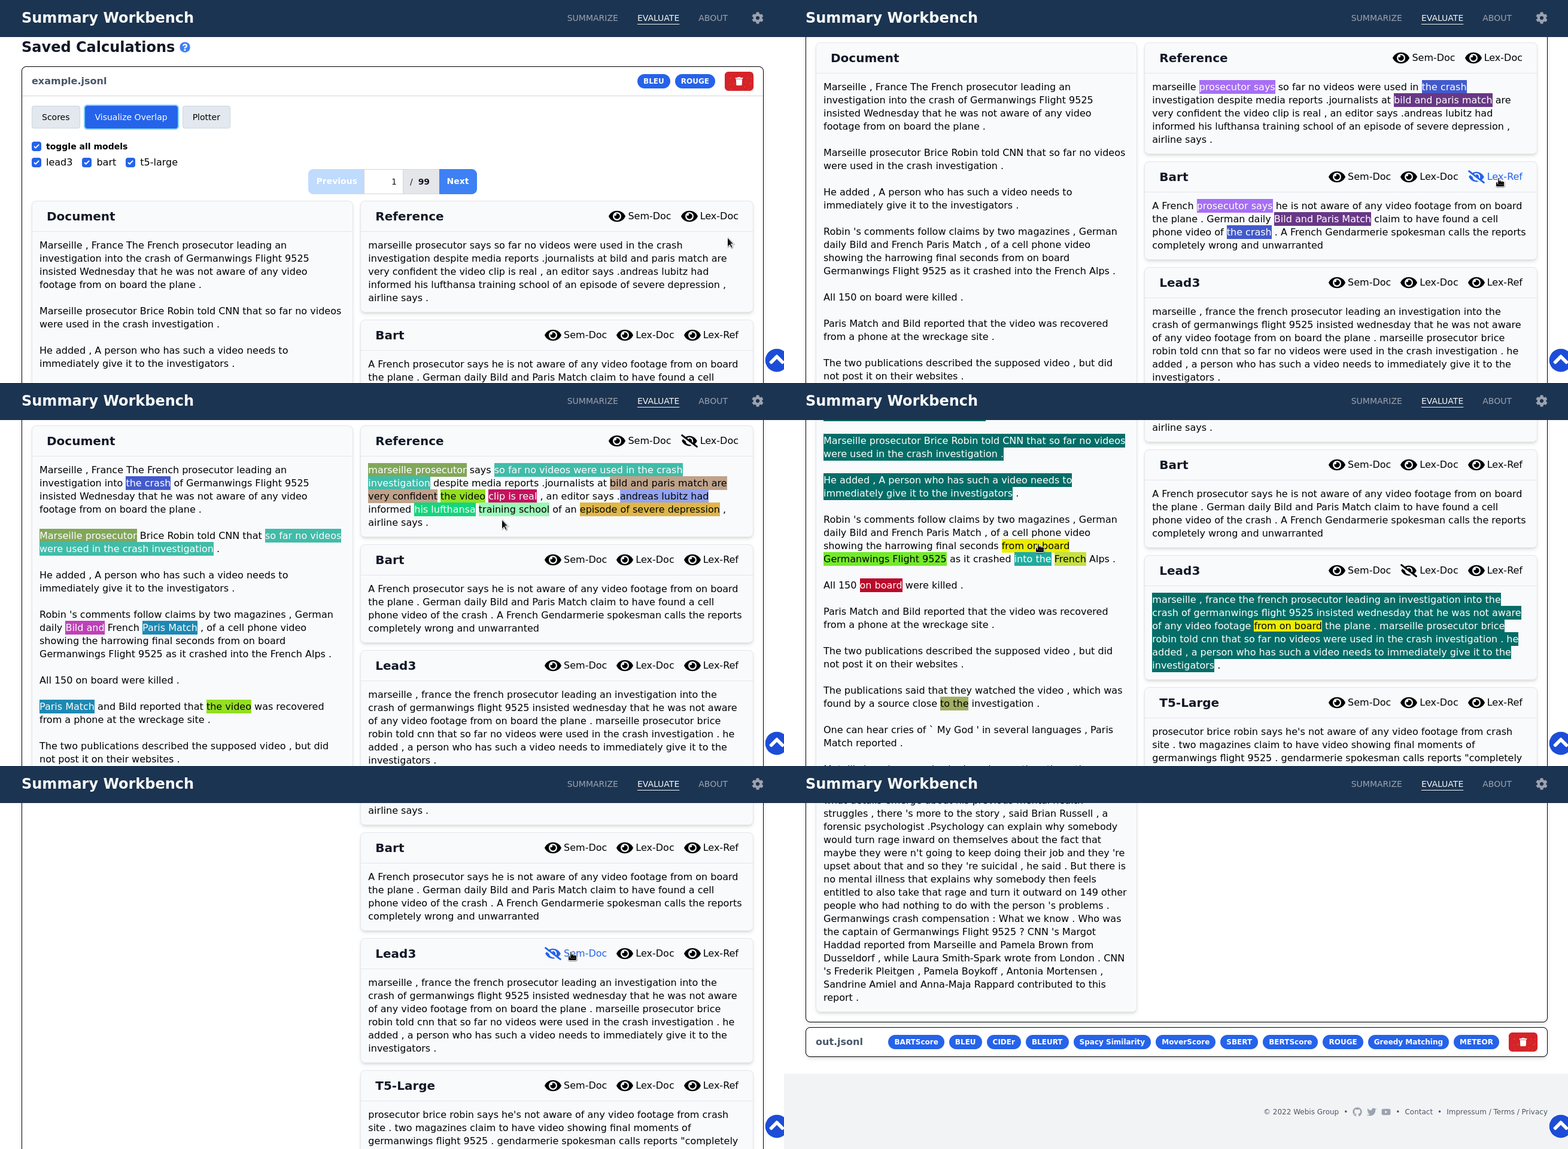
The second tab presents the evaluated texts for textual inspection.
By clicking the eye-icon labeled with Lex-Doc and Lex-Ref, the lexical overlap is shown with the document and the reference respectively.
By clicking the eye-icon labeled with Sem-Doc, the semantic overlap with the document is shown, which is computed by finding the top 3 most similar sentences using spaCy similarity for each summary sentence and highlighting them by the fraction of sentences that found this sentence.
Plotter Feature of the Evaluation View
The third tab shows a graph where a scatter plot of 2 selected metrics is shown. When only one metric is selected, the other values for the other axis will be drawn from a uniform distribution. Points can be selected to show a view similar to Visualize the Overlap for the Examples.
